InfluxDB Terminal Dashboards with FluxDash
28/Dec 2015
Overview
FluxDash is a dashboard terminal ui that is fully configurable through json files. You can either give it an indivudual json file or a folder and it will read any json file in the folder and attemp to turn it into a dashboard. You can then move between dashboard by pressing
Features
- Sparklines
Sparklines are a simplified single stat linechart that gives you basic trending over time. Example json:
"sparklines": {
    "Height": 1,
    "lines": [{
        "from": "/system.cpu/",
        "title": "CPU",
        "where": "",
        "type": 2,

        "height": 1,
        "linecolor": 5,
        "titlecolor": 0
    }, {
        "from": "/system.mem.free/",
        "title": "System Free memory",
        "type": 3,
        "height": 1
    }, {
        "from": "/system.mem.cached/",
        "title": "System Cached memory",
        "type": 3,
        "height": 1
    }, {
        "from": "/system.mem.buffers/",
        "title": "System Buffers memory",
        "type": 3,
        "height": 1
    }]
}
- MultiSpark
A set of sparklines that have been expanded automatically based on a influxdb tag.
- Gauge
Gauge shows you the mean and max over the set time period.
- BarChart
BarChart is a graph that represents grouped data.
Json Definition
- Types:
    const(
    Short   = 1 #human readable numbers 100 1k 10m 1b
    Percent = 2 #Data should be treated as a percent
    Bytes   = 3 #human readable bytes 1b 30kb 1mb 10gb 1tb
    Time    = 4 #human readable time duration 1sec 5m 1h
)
- From: From is the measurement you are going to query in influxdb.
“/system.cpu.*/” example regex.
“system.cpu” example full measurement name.
- Where: Where allows you to add to the where clause in your influxdb query.
“service='name'“
“`service=‘name’ AND host=‘hostname’”
Example Dashboard
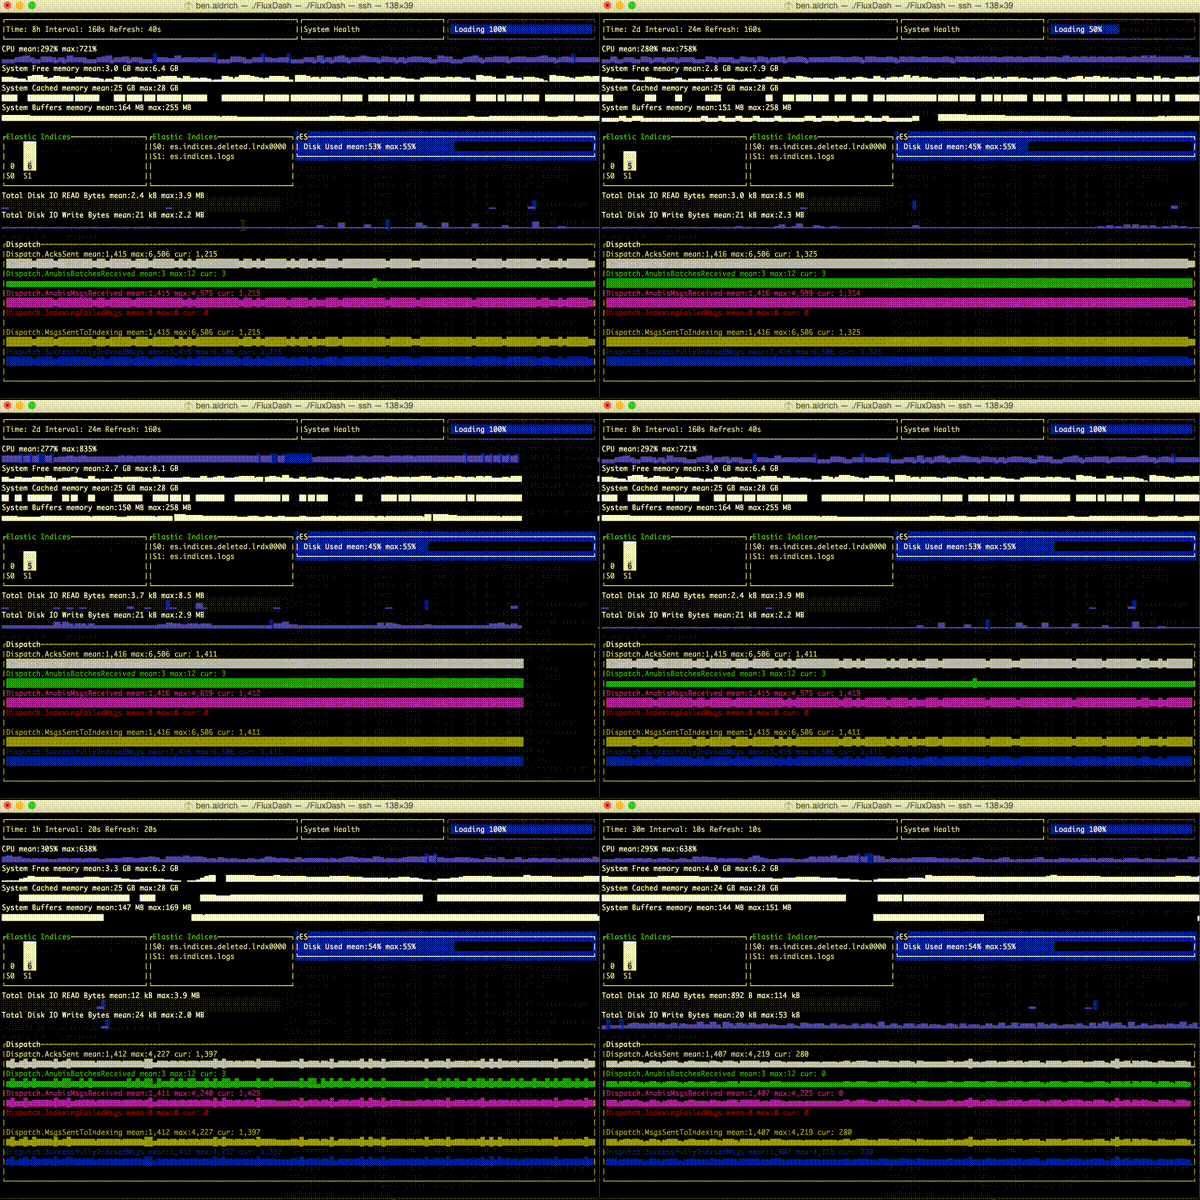
Here is an example dashboard. In the image below you will see that I am adjusting the time range of the queries for the dashboard. This is accomplished by pressing
{"15m", "30m", "1h", "8h", "24h", "2d", "5d", "7d"}
This will become configurable eventually but these are the most commonly used in our system.

You will also notice that the refresh and the group by interval are adjusted based on the time range. Again this will be come configurable at a later date.
{
    "rows": [{
        "height": 1,
        "span": 12,
        "offset": 0,
        "columns": [{
            "height": 1,
            "span": 6,
            "offset": 0,
            "timep": {
                "height": 3,
                "border": true
            }
        },{
            "height": 1,
            "span": 3,
            "offset": 0,
            "p": {
                "height": 3,
                "text": "System Health",
                "border": true
            }
        },
        {
            "height": 1,
            "span": 3,
            "offset": 0,
            "loading": {
                "height": 3,
                "border": true,
                "bordertop": true,
                "borderbottom": true,
                "borderright": true,
                "borderleft": true,
                "BarColor": 5,
                "BorderFg": 5
            }
        }]
    },
     {
        "height": 1,
        "span": 12,
        "offset": 0,
        "columns": [{
            "height": 1,
            "span": 12,
            "offset": 0,
            "sparklines": {
                "Height" : 1,
                "lines": [{
                    "from": "/system.cpu/",
                    "title": "CPU",
                    "where": "",
                    "type": 2,
                    "height": 1,
                    "linecolor" : 5,
                    "titlecolor": 0
                }, {
                    "from": "/system.mem.free/",
                    "title": "System Free memory",
                    "type": 3,
                    "height": 1
                },
                {
                    "from": "/system.mem.cached/",
                    "title": "System Cached memory",
                    "type": 3,
                    "height": 1
                },{
                    "from": "/system.mem.buffers/",
                    "title": "System Buffers memory",
                    "type": 3,
                    "height": 1
                }]
            }
        }]
    },
     {
        "height": 1,
        "span": 12,
        "offset": 0,
        "columns": [{
            "height": 1,
            "span": 3,
            "offset": 0,
            "barchart": {
                "height": 6,
                "from": "/es.indices/",
                "where": "service='gomaintain'",
                "borderLabel": "Elastic Indices"
            }
        },{
        "height": 1,
        "span": 6,
        "offset": 0,
        "gauge": {
            "height": 3,
            "from": "/es.*.FS.Used.Percent/",
            "where": "service='gomaintain'",
            "border": true,
            "BorderLabel": "ES",
            "bordertop": true,
            "borderbottom": true,
            "borderright": true,
            "borderleft": true,
            "BarColor": 5,
            "BorderBg": 5,
            "label": "Disk Used"
        }
    }]
},{
        "height": 1,
        "span": 12,
        "offset": 0,
        "columns": [{
            "height": 1,
            "span": 12,
            "offset": 0,
            "sparklines": {
                "Height" : 1,
                "lines": [{
                    "from": "/system.disk.[^dm|util].*.read.bytes/",
                    "title": "Total Disk IO READ Bytes",
                    "where": "",
                    "type": 3,
                    "height": 1,
                    "linecolor" : 5,
                    "titlecolor": 0
                },{
                    "from": "/system.disk.[^dm|util].*.write.bytes/",
                    "title": "Total Disk IO Write Bytes",
                    "where": "",
                    "type": 3,
                    "height": 1,
                    "linecolor" : 5,
                    "titlecolor": 0
                }]
            }
        }]
    },
         {
        "height": 1,
        "span": 12,
        "offset": 0,
        "columns": [{
            "height": 1,
            "span": 12,
            "offset": 0,
            "multispark": {
                "height": 3,
                "from": "/Dispatch.*/",
                "where": "service='godispatch'",
                "borderLabel": "Dispatch",
                "border" : true,
                "Bordertop" : true,
                "Borderbottom" : true,
                "Borderleft" : true,
                "Borderright" : true,
                "Borderfg": 4,
                "bg" : 1,
                "type": 1,
                "autocolor": true,
                "titlecolor": 6
            }
        }]
    }]
}